March 2025 Manufacturing Business Outlook Survey
Note: Survey responses were collected from March 10 to March 17.
Manufacturing activity in the region expanded overall but was less widespread, according to the firms responding to the March Manufacturing Business Outlook Survey. The survey’s indicators for current general activity, new orders, and shipments declined but remained positive. The employment index rose to a multiyear high. Both price indexes remain elevated. The survey’s future indicators suggest less widespread expectations for growth over the next six months.
Current Indicators Remain Positive but Decline
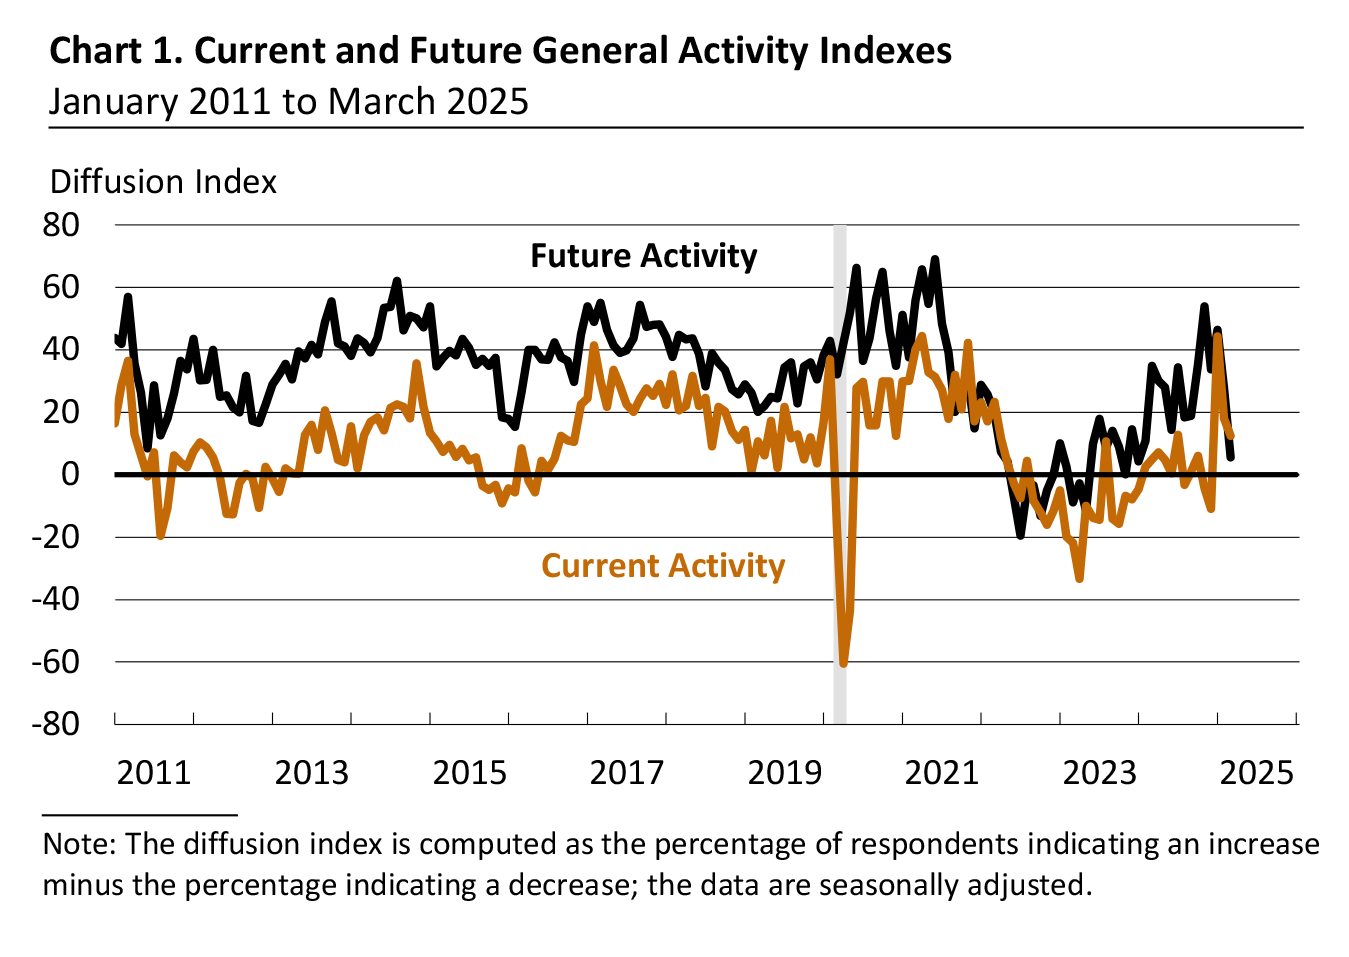
The diffusion index for current general activity declined from 18.1 to 12.5 in March, its second consecutive decrease (see Chart 1). Almost 31 percent of the firms reported increases in general activity this month (down from 41 percent last month), while 18 percent reported decreases (down from 23 percent); 47 percent reported no change (up from 35 percent). The indexes for new orders and shipments fell more sharply: The new orders index fell 13 points to 8.7, and the shipments index dropped 24 points to 2.0.
The firms continued to report overall increases in employment, and the employment index increased from 5.3 to 19.7 this month, its highest reading since October 2022. Almost 22 percent of the firms reported increases, while 2 percent reported decreases, and 71 percent of the firms reported no change in employment levels. The average workweek index rose 6 points to 8.7.
Firms Continue to Report Overall Price Increases
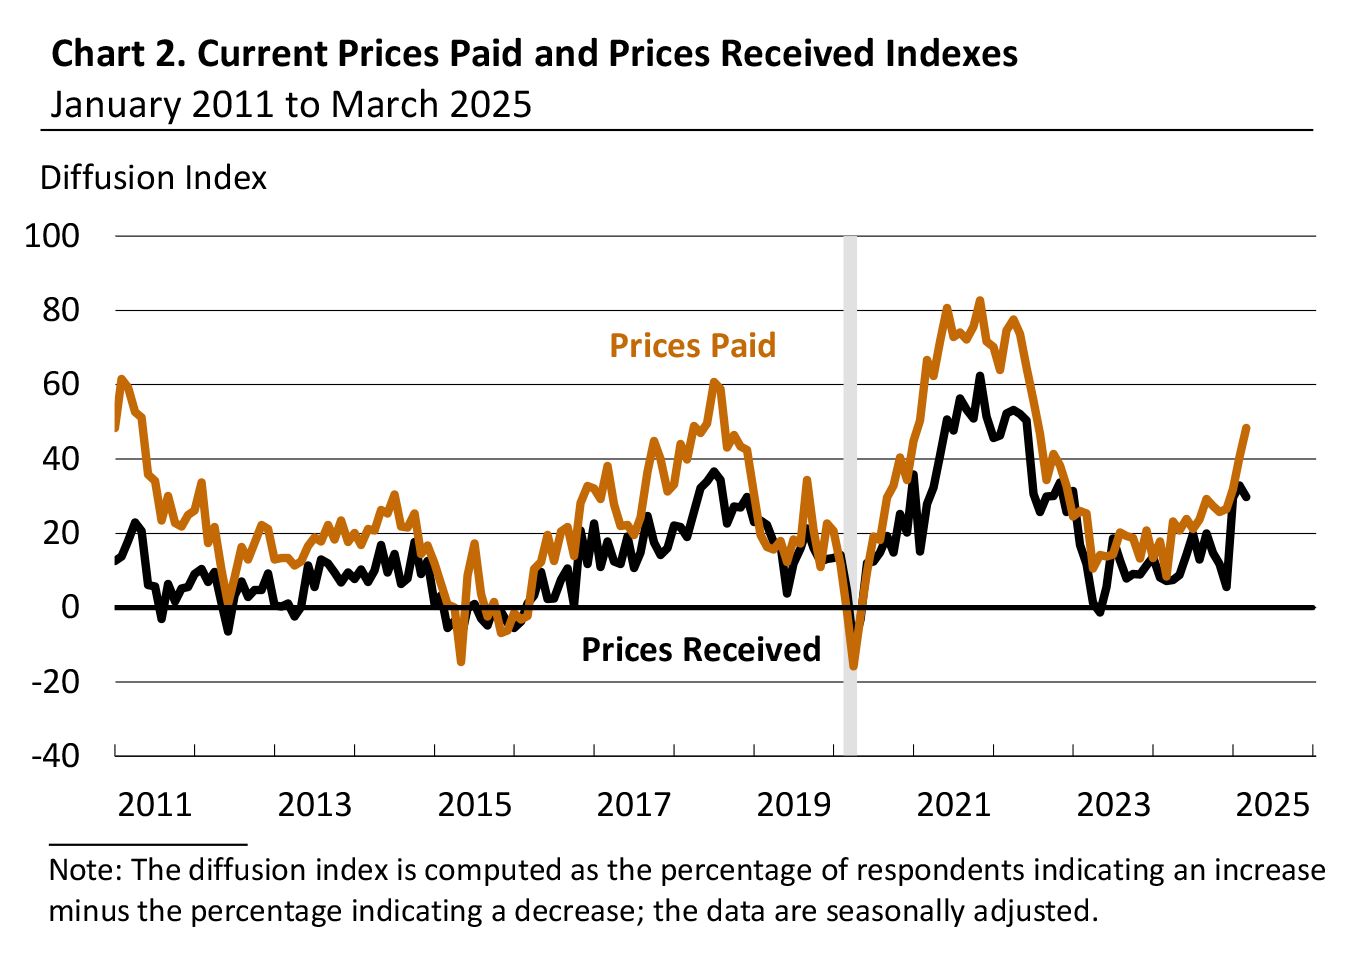
The prices paid index increased 8 points to 48.3, its fourth consecutive increase and highest reading since July 2022 (see Chart 2). Over 48 percent of the firms reported increases in input prices, while none reported decreases; 48 percent of the firms reported no change. The current prices received index moved down 3 points to 29.8. Thirty percent of the firms reported increases in prices received for their own goods, none reported decreases, and 66 percent reported no change.
Firms Report Lower Production, Little Change in Capacity Utilization
In this month’s special questions, the firms were asked to estimate their total production growth for the first quarter ending this month compared with the fourth quarter of 2024. A higher share of firms reported a decrease in production (47 percent) compared with the share reporting an increase (34 percent). Regarding firms’ capacity utilization for the current quarter and one year ago, the median current capacity utilization rate reported among the responding firms was unchanged at 70 to 80 percent.
Over 53 percent of the firms reported labor supply as at least a slight constraint to capacity utilization in the current quarter, and 47 percent of the firms cited supply chains as a constraint. Additionally, 79 percent of the firms indicated that uncertainty was at least a slight constraint this quarter, with 30 percent categorizing the impact as moderate and 24 percent categorizing it as significant. Looking ahead over the next three months, most firms expect the impacts of various factors to stay the same. However, 64 percent of the firms expect the impact of uncertainty to worsen over the next three months, and 44 percent expect supply chain impacts to worsen.
The firms were also asked about their plans for different categories of capital expenditures for this year relative to 2024. The share of firms expecting higher total capital spending this year (23 percent) slightly exceeded the share expecting lower spending (20 percent), and 57 percent expect spending to be the same. When this question was last asked in October, over 51 percent of the firms had expected higher spending, 21 percent had expected lower spending, and 27 percent had expected the same spending for 2025 relative to 2024.
Expectations for Growth Are Less Widespread
The diffusion index for future general activity fell 22 points to 5.6 in March, its lowest reading since January 2024 (see Chart 1). The share of firms expecting increases in activity over the next six months (31 percent) exceeded the share expecting decreases (26 percent); 37 percent expect no change. The future new orders index dropped 31 points to 2.3, its lowest reading since May 2023, and the shipments index fell 25 points to 11.3, its lowest reading since June. The firms continue to expect an overall increase in employment, but the future employment index declined from 23.7 to 17.3. The future capital expenditures index was little changed at 13.4.
Summary
Responses to the March Manufacturing Business Outlook Survey suggest regional manufacturing activity expanded overall this month. The indicators for current activity, new orders, and shipments all declined but remained positive. On balance, the firms indicated an increase in employment and continued to report increases in prices. The survey’s broad indicators for future activity suggest less widespread expectations for growth over the next six months.
Special Questions (March 2025)
| An increase of: | % of firms | Subtotals |
|---|---|---|
| 10% or more | 12.5 | % of firms reporting an increase: 34.4 |
| 5-10% | 6.3 | |
| 0-5% | 15.6 | |
| No change | 18.8 | |
| A decline of: | ||
| 0-5% | 21.9 | % of firms reporting a decrease: 46.9 |
| 5-10% | 9.4 | |
| 10% or more | 15.6 |
Capacity Utilization Rate |
2025:Q1 % of Reporters |
2024:Q1 % of Reporters |
|---|---|---|
| Less than 30% | 0.0 | 0.0 |
| 30-40% | 0.0 | 6.1 |
| 40-50% | 3.1 | 6.1 |
| 50-60% | 15.6 | 6.1 |
| 60-70% | 21.9 | 12.1 |
| 70-80% | 34.4 | 45.5 |
| 80-90% | 21.9 | 15.2 |
| 90-100% | 3.1 | 9.1 |
| Median Utilization Rate | 70-80 | 70-80 |
|
Not at all (%) |
Slightly (%) |
Moderately (%) |
Significantly (%) |
|
|---|---|---|---|---|
| Energy markets | 84.4 | 9.4 | 3.1 | 3.1 |
| Financial capital | 90.6 | 6.3 | 0.0 | 3.1 |
| Labor supply | 46.9 | 25.0 | 12.5 | 15.6 |
| Supply chains | 53.1 | 28.1 | 9.4 | 9.4 |
| Uncertainty | 21.2 | 24.2 | 30.3 | 24.2 |
| Other factors | 73.7 | 0.0 | 5.3 | 21.1 |
|
Worsen (%) |
Stay the same (%) |
Improve (%) |
|
|---|---|---|---|
| Energy markets | 21.9 | 68.8 | 9.4 |
| Financial capital | 16.1 | 80.6 | 3.2 |
| Labor supply | 15.6 | 75.0 | 9.4 |
| Supply chains | 43.8 | 56.3 | 0.0 |
| Uncertainty | 63.6 | 27.3 | 9.1 |
| Other factors | 27.8 | 66.7 | 5.6 |
|
Higher (% of reporters) |
Same (% of reporters) |
Lower (% of reporters) |
Diffusion Index |
|
|---|---|---|---|---|
| Total capital spending | 23.3 | 56.7 | 20.0 | 3.3 |
| Software | 29.0 | 58.1 | 12.9 | 16.1 |
| Noncomputer equipment | 25.8 | 54.8 | 19.4 | 6.5 |
| Energy-saving investments | 7.4 | 64.5 | 18.5 | -11.1 |
| Computer and related hardware | 16.1 | 74.2 | 9.7 | 6.5 |
| Structure | 9.7 | 64.5 | 20.7 | -11.0 |
| Other | 5.6 | 83.3 | 11.1 | -5.6 |
Return to the main page for the Manufacturing Business Outlook Survey.